Writing regime
In our previous study on fs laser writing into Corning Gorilla Glass21, we have shown a thermally driven RI change affecting a large area beyond the focal point, thus generating a 20 by 40 μm multilayer structure. Such a structure is too large if one wants to make a grating of a few microns period. Eaton et al.20 have simulated that by lowering the repetition rate below 100 kHz in fused silica, thermal accumulation is significantly reduced between each pulse since heat has time to dissipate before the arrival of the next pulse. In order to characterize the impact of such thermal accumulation in our glasses, we have incrementally reduced the repetition rate of our laser with a pulse picker while keeping all the other writing parameters constant (λ = 515 nm, v = 50 mm/s, Ep = 825 nJ, NA 0.65). The results are shown in Fig. 2.
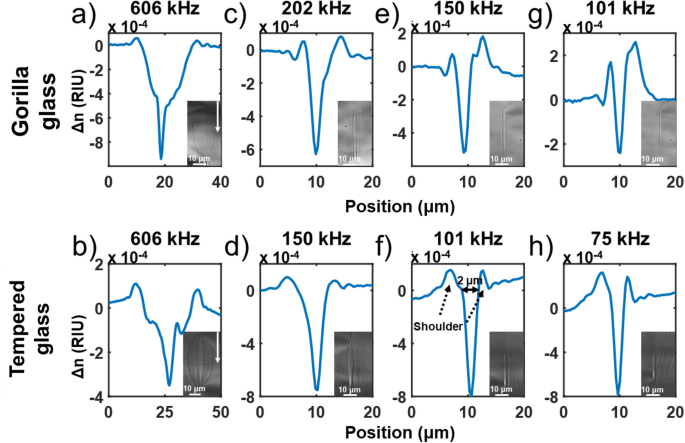
Integrated RI profile tomography and cross-section picture showing the transition and the contribution of thermal accumulation on the RI profile after fs exposure for Gorilla and tempered glass at a writing speed of 50 mm/s. In both cases, the structure is narrower outside of the heat accumulation regime. The white arrows on the cross-section pictures indicate the laser direction. Bigger pictures of the cross-section inset are provided in supplementary material.
As one can observe in Fig. 2, when outside of the heat accumulation regime (e, f), narrower and elongated structures are written, with significantly higher eccentricity. This transition to this regime occurs gradually around 150 kHz for Gorilla glass (Fig. 2e) and 101 kHz for tempered glass (Fig. 2f), which suggests that Gorilla glass has a slightly higher heat diffusion rate than the tempered glass. Below such frequencies, the RI profile is composed of a narrow peak of negative index (~ 2 μm) with small positive shoulders. Such a narrow structure could come from filamentation since the peak power for a 825 nJ pulse is Pp = 3300 kW, which is above the self-focusing power threshold (Pth = 550 kW) defined by Eq. (2)24.
$$ P_th = \frac\alpha \lambda^2 8\pi n_0 n_2 $$
(2)
where α is a constant related for the spatial beam distribution for a Gaussian beam which is equal to 3.77, λ the center wavelength of the pulse, n0 the linear RI which is 1.523 and n2 the non-linear RI coefficient which is 4.77 × 10⁻²⁰ m2/W for aluminosilicate glass25. We then attempted some optimization of this regime by varying the speed from 0.1 to 50 mm/s and at a constant pulse energy between 165 and 825 nJ at a repetition frequency of 101 kHz for both glasses. The results are shown in Fig. 3.
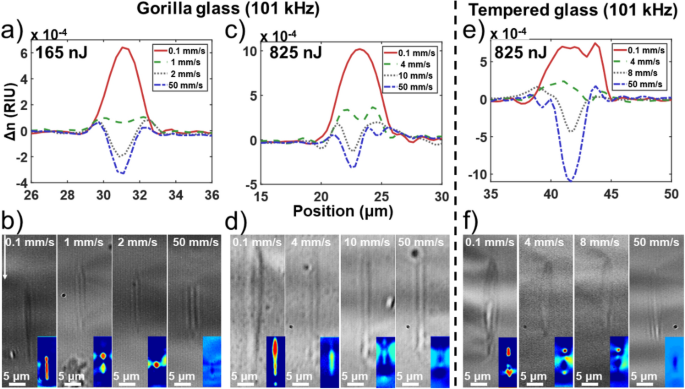
Evolution of the induced integrated RI profile tomography change under fs exposure for different writings speeds at a repetition rate of 101 kHz in Corning Gorilla (a–c) and tempered aluminosilicate glass (e). (b,d,f) are bright-field images of the inscribed cross-sections for different writing speeds, while the colored inset is the output transmission field under white light illumination showing either single-mode or multi-mode propagation or no propagation at all. The illumination scale goes from blue (low light) to red (high brightness) relative to the surrounding.
One can observe in the 3 cases reported in Fig. 3 that there is a transition from a negative to positive RI when increasing the fluence, either through writing speed reduction or pulse energy increase, for the two different types of glass. The negative RI change at low fluence is believed to be attributed to the quenching of the glass at a lower fictive temperature than the glass thermal history thus reducing the local density19. The positive RI change could result from accumulation of color centers17 or from structural restructuration favoring the 3–4 Si–O ring members at the expanse of the 5–6 ones18. Note that the guidance observed in Fig. 3b,d,f) in negative index waveguides is not centered on the main index change and is likely due to positive index artifact around the center. Such positive index change is of high interest for waveguide writing. This positive index writing regime does not appear to be specific to one glass, but the transition threshold speed and frequency threshold are dependant on the material. Consequently, the transition appears to be fluence driven with the fluence (F) definition express at Eq. (3)26.
$$ F = \left( \fracR_r \omega_0 v \right)\fracE_1p \pi \omega_0^2 $$
(3)
where v is the writing speed, Rr the repetition rate, E1p the pulse energy and ω0 the waist of the beam for 0.65 NA microscope objective. From our results, positive index change occurs for a fluence above 8.7 × 10⁶ J/m2 for Corning Gorilla glass and 1.4 × 10⁷ J/m2 for the tempered aluminosilicate glass. On the cross-section view at Fig. 3b,d,f), it can be observed that an increase in fluence elongates the RI change region (increases the eccentricity of the ellipsoid). This elongated feature is likely due to filamentation into the glass. Lower pulse energy for the same fluence generates finer structure. One must be careful when using this writing regime for waveguides, as such waveguides may become multi-mode in the vertical direction.
VRNG writing parameters
To inscribe VRNGs, a high RI change in a very thin elongated region is required. The writing regime proposed in the last section is ideal for this. To optimize the writing of VRNG structures, we compare two writing regimes: one at low pulse energy with high fluence and the other at high pulse energy with low fluence. To this end, a grid of small VRNGs composed of 30 lines with a 3 μm pitch have been written with different fluences (from 6.5 to 104 × 106 J/m2 and from 1.3 to 34 × 106 J/m2) and different number of passes (1 to 8 passes). A 3 μm pitch was selected to ensure the highest line density without overlap between inscription lines. These results are displayed in Fig. 4. For a VRNG, the total phase change (\(\Delta \phi \propto\Delta n\cdot h\)) is more relevant than the RI change since the efficiency of the grating is determined by the phase change induced. For instance, a π rad phase change minimises power in the 0th order and thus maximises power into diffraction orders.
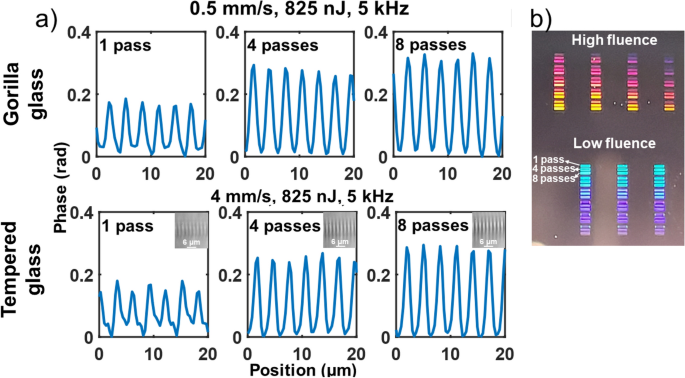
(a) Phase changes for the best recipes from the parameter grid presented in (b), which shows diffraction patterns in transmission for the 3 μm pitch VRNGs written at high and low fluence in Gorilla and tempered glass for various number of passes. The depth of the inscription increases with the number of passes which explains the increase in phase change. The scan parameters used were from 0.1 to 4 mm/s, 1 to 8 passes, 125 to 865 nJ of pulse energy and repetition rates set with a pulse picker of 5 kHz and 80 kHz. Bigger pictures of the cross-section inset are provided into supplementary material.
As shown on Fig. 4, in both cases the best recipe was found at the higher pulse energy and lower fluence cases which produces a phase change of 0.3 rad. Multiple passes increases the cross-section length by a factor 1.67 yielding the same factor of increase in phase change. Both glasses produce similar maximum phase change but the writing speed in tempered glass is 8 times faster, therefore this glass has been selected for the application demonstration.
Cellphone integrated spectrometer
A 3 by 0.5 mm VRNG was inscribed 100 μm under the surface of the tempered glass and placed in front of the smartphone camera as described in Fig. 1a and shown on Fig. 5a. In normal day light illumination, the grating has no effect on the image taken by the camera as long as there is no bright light point source within the image (for instance, the sun). However, in a low light environment, parasitic spectra will appear in pictures for every light source as shown on Fig. 5b. Hence, the VRNG can be kept on the camera in many situations without impacting the main functionality of the device. To demonstrate its use as a spectrometer, we first calibrated the spectrometer using a bandpass filter as described in Fig. 1b. The calibration filter was placed in front of the glass and illuminated by a 10 W halogen lamp as shown on Fig. 1a. The grating caused a diffracted spectrum to appear on the pixel grid of the camera. The best results were using the 2nd diffraction order. Along this spatially distributed colored pattern, only the red, green or blue (RGB) pixels yielding the maximum signals were used to sample the spectrum. Therefore, the spectrum was divided into 3 bands: red, green and blue. This strategy was used to counteract the possible crosstalk between diffraction orders such as the 2nd (used) and the 3rd (parasitic) orders. The detection band and isolation are shown in supplementary material.
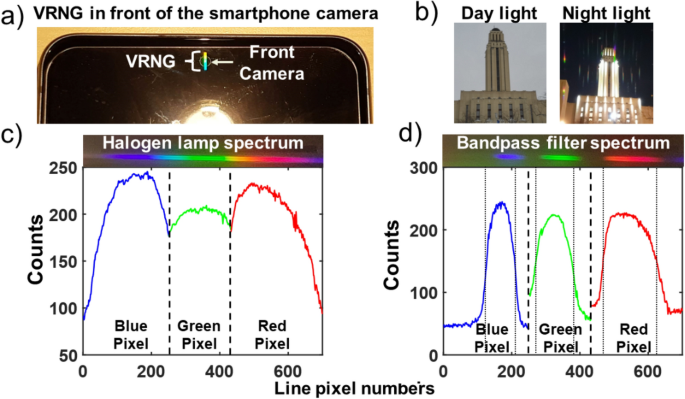
(a) VRNG inscribed into tempered glass and placed in front of the smartphone camera. (b) The grating does not affect the day-light picture quality taken with the camera if no bright sources are present, but the diffraction spectra does appear if a bright light is brought close to it or in a low light environment. In (c), we show the 2nd diffraction order spectrum recorded by the camera generated by the VRNG from the halogen lamp and with the calibration filter in front of it (d). Each spectrum recorded is averaged over 3-pixel line to reduce the noise.
One can observe the match between the recorded spectra and the RGB fragmentation detection scheme presented at Fig. 5c and d for the halogen lamp and the calibration filters. The edges at half maximum of each band produced by the calibration filters were used to set 6 wavelength points for calibration. Then a 2nd order polynomial fit was used to find the calibration function as shown in Eq. (4).
$$ \lambda \, = \, 0.000012\text m^2 + \, 0.4\text m + \, 400 $$
(4)
where m is the pixel number. Despite the theoretical sinusoidal behavior of the diffraction, the calibration function was found to be quasi-linear with a detector resolution of 0.4 nm/pixel. This linear dispersion comes from the use of the VRNG in the small angle approximation regime. The optical resolution of the detector was measured using a Helium Neon laser line centered at 632.8 nm and was found to cover 9 pixels which represent 3 nm at full width at half maximum. Using a finer writing pitch would increase the dispersion of the grating and thus the resolution of the spectrometer. However, a fine pitch—if it can be resolved through the writing—brings a higher diffraction angle which may result in the spectrum image outside of the field-of-view of the camera. The 3-µm pitch grating used produces a full 2nd order spectrum that extends up to 90% of the field of view of the camera. The diffraction power efficiency at the 2nd order was measured to be 0.3% of the incident light at 632.8 nm. The form factor of the grating is well suited for utilizing the phase mask writing scheme which has the advantage of not only increasing the resolution but most importantly to drastically reduce the production time to allow mass production.
Spectrometer testing example
As a proof of concept using this calibrated spectrometer, the absorption spectrum produced by different concentration of rhodamine 6G in water put into the loading chamber presented in Fig. 1a is shown in Fig. 6a. The initial concentration was taken at 1 g/L.
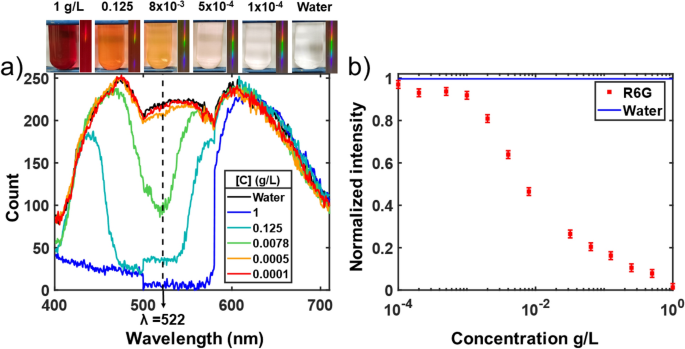
(a) Raw absorption spectrum data produced by different concentrations of rhodamine 6G in water. The recorded spectrum from each concentration is shown in the inset. Raw data is displayed to show physical device performance and limitations. (b) The intensity at λ = 522 nm for all the concentrations used normalized to the water spectrum. The signal variation at 500 nm comes from different gains parameters between the RGB bands, which is performed internally in the firmware of the camera.
The spectra presented in Fig. 6a are the average result of 3 lines of pixels to reduce the noise. The remaining noise was quantified by processing 10 pictures of the water spectrum and was determined to be ± 0.02 units at 2σ (95% confidence interval) as shown in the error bar of the water point data in Fig. 6b. The upper limits of the concentration error introduced by that noise can be evaluated by linear interpolation of the lowest variation of the curved profile in Fig. 6b occurring near the concentration detection limits around 0.001 g/L. Doing so, the error is found to be of 0.4 mg/L. One can observe in Fig. 6a that the 0.1 mg/L spectrum overlaps with the water spectrum, but a small difference is observed for the 0.5 mg/L spectrum. The absorption peak is found near λ = 522 nm which correspond to the expected peaks of rhodamine 6G in water which is slightly shifted from 530 nm in ethanol27 as reported in28. Therefore, the limit of detection of rhodamine 6G is found at 0.5 ± 0.4 mg/L for a 5 mm thick loading chamber. A better control over the cameras acquisition parameters could offer an opportunity to stretch the detection limits, standardize the spectrum across the RGB detectors and linearize the detection.
Rhodamine 6G was used in this study since it is a well know dye with a strong absorption band in the visible. Not all analytes of interest have as high a coefficient of absorption which lead to higher limits of detection. This could be problematic for certain applications like water contamination evaluation where concentrations are in the order of the mg/L. To mitigate this difference in efficiency, the thickness of the loading chamber can be increased which will have an exponential impact on the detection limits. However, indirect detection systems could be also evaluated by measuring the impact on an efficient absorber—such as rhodamine—produced by the presence of an analyte. Thereby, a selective Cu2+ colorimetric sensor was demonstrated capable of detection concentration in the μg order using rhodamine derivative29 as well as for lead30,31 and cadmium30 paving the way to useful field spectrometer.