Within a framework of this research, we created a complete capturing, modeling and analysis pipeline (depicted in Fig. 2) specifically tailored to access hydration proprieties of skin with SmartWatch in order to identify the exact moment when sweating occurs. Our models are aided by direct measurements of tissue’s functional properties using custom-tailored sensor. By combining powerful Machine Learning (ML) techniques, state-of-the-art numerical simulation algorithms for photon transport in biological techniques and clinical studies we achieved near-instantaneous evaluations of human skin PPG signals and their changes related to different stages of sweating. We performed rigorous validation of the developed pipeline by comparing with measurements obtained using laboratory grade hardware in vivo. The developed framework serves as a tool in the ongoing internal development of the next generation of sensing capabilities.
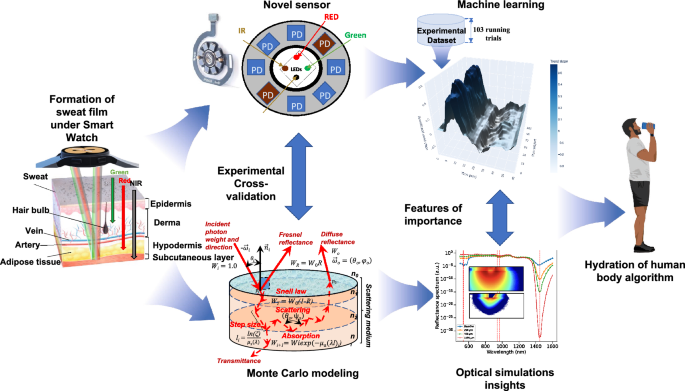
Our capture-to-sensing pipeline. Here: a sweat film is formed under the SmartWatch prototype; Custom-made sensor evaluates change in PPG signal at a range of wavelengths and distances; The trends in the signal are investigated using experimentally validated numerical algorithms of light transport in skin; Particular features of importance due to fluctuations of wet/dry skin optical properties are extracted based on their significance and a ML method is trained to readily detect them; Finally, sweat loss is quantitatively accessed and recommendations to consumer are made.
Novel hardware design and in silico experimentation
When applied to human skin, PPG signal formation is mandated by light absorption and scattering within the tissue due to blood, melanin, collagen, water and other pigments as well as the specular reflection at skin-air interface19,20 (Fig. 3a, b). For instance, notable bands and corresponding absorptions/scattering effects for melanin, blood hemoglobin at 416, 542, and 575 nm, and water at 980 nm have been extensively studied in the past18,19,20. In other words, spectral composition of the light penetrating through biological tissues largely depends on the concentration and spatial distribution of chromophores within the skin. When applied to a practical wearable application, the accuracy of the registration of the PPG signal largely depends on multiple other factors which include but not limited to: sensor geometry and its position, band stiffness and environmental factors such as temperature, humidity, etc. Moreover, the optimal parameters of the sensor such as its geometry, numerical aperture, source-detector shape and separation, wavelengths, etc. require careful selection and the most optimal settings need to be accurately studied and their performance evaluated. This step is feasibly performed in silico by means of numerical simulations and involves computing the light-tissue interactions which are formally described by the Radiative Transfer Equation (RTE). The RTE theory originates from the point of energy conservation and serves as a basis for photometry20,21,22. This theory has been extensively used in a number of studies including atmospheric and ocean scattering, astrophysics, and subsequently biomedical optics. Numerous attempts were made in the past to evaluate physiological properties of the tissue and connect them with the diffusive scatted and absorbed optical radiation23,24,25,26,27,28,29,30. The macroscopic energy balance and statistical average of light transport and their energy conservation through the scattering and absorptive media at equilibrium is described as:
$$\left( \vec\omega \cdot \vec\nabla \right)L\left( \varvecp,\vec\omega \right) = – \left( \mu_s \left( \lambda \right) + \mu_a \left( \lambda \right) \right)L\left( \varvecp,\vec\omega \right) + \mu_s \left( \lambda \right)\mathop\int\!\!\!\!\!\int\mkern-21mu \bigcirc p\left( \vec\omega ,\vec\omega ^\prime \right)L\left( \varvecp,\vec\omega ^\prime \right)d\omega^\prime + Q\left( \varvecp,\vec\omega \right)$$
(1)
Here, \(L\left( \varvecp,\overrightarrow\omega \right)\) refers to the energy radiance in the medium at a specific point \(\varvecp\) in the direction \(\overrightarrow\omega \), where \(\mu _s\left(\lambda \right)\) and \(\mu _a\left(\lambda \right)\) are the spectrally-resolved scattering and absorption coefficients, \(p\left(\overrightarrow\omega ,\overrightarrow\omega \prime\right)\) corresponds to the scattering phase function and \(Q(\varvecp,\overrightarrow\omega )\) represents the optical radiation source function, respectively. \(\overrightarrow\nabla L\) represents the spatial gradient of the radiance telling how much radiance changes per unit distance. For homogeneous, single-layered materials, the RTE is usually solved by analytical methods such as diffusion approximation. Nevertheless, due to the complex and inhomogeneous structure of human skin, no general analytical solution to RTE for our sensor configuration exists that can describe the detected signal and how it is affected by its structural or physiological changes.
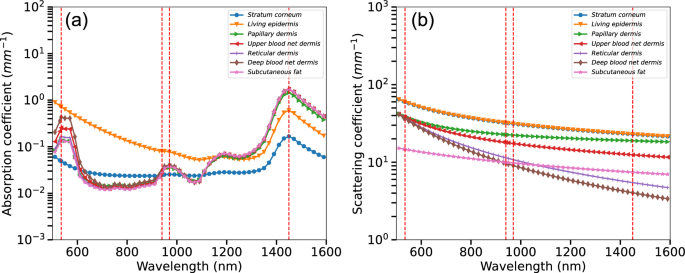
Optical properties of human skin and proposed sensor configuration. Here, (a)—absorption coefficients of key skin tissues chromophores including melanin, oxy-hemoglobin, deoxy-hemoglobin, baseline and water; (b)—scattering coefficients of the functional tissue layers.
Fortunately, there is an example of a stochastic alternatives: the Monte Carlo (MC) method which has been, throughout the years, a tool-of-choice for the assessment of optical radiation propagation and spatial localization of signals in biological tissues in the field of biomedical optical diagnostics. MC method was first introduced for simulation of light propagation in biological tissue in 1983 by Wilson and Adam31. Subsequently, the MC has been further developed by multiple research groups and is now utilized widely in Biomedical Optics31,32,33,34,35. The MC is now considered a “gold standard” and a convenient tool for modeling signals due to the possibility of accounting for the complex structure of the object under study, the boundary conditions, the geometry of the probe beam and other features. MC enables a direct comparison between simulated and experimental results, as well as predicting the outcomes of future measurements when a sufficiently large number of statistical data is accumulated. However, the accuracy of such modeling is determined by the cost of machine time (i.e. the method is highly resource consuming), as well as the correspondence of the model to the simulated object. Therefore, a direct application of MC method was not adopted widely in wearables due to MC’s notorious computational inefficiency, the lack of domain-specific knowledge in tissue biology/optics and a number of constrains related to dynamic nature of PPG signal acquisition.
MC method is based on modeling energy transfer through the medium and the corresponding principles have been described comprehensively elsewhere22. Briefly, multiple so-called photon packets are first assigned with statistical unit weight \(W_0\) and injected into a modeling medium (Fig. 4a). The packets undergo a sequence of randomly-sampled events representing light-media interactions (e.g. scattering, absorption, reflection, refraction and media layer transfer at the boundaries). The path length distribution \(p\left(l\right)\) for a photon packet propagating distance \(l\) between scattering events is determined randomly and follows the Beer–Lambert law as \(p\left(l\right)=\upmu _t\left(\uplambda \right)e^-\upmu _t\left(\uplambda \right)l\). Subsequently, the photon packet position is updated as \(\varvecp_\texti=\varvecp_\texti-1+\overrightarrow\upomega _i\primel_\texti\) and its statistical weight is scaled by absorption \(W_i=W_i-1e^-\upmu _a\left(\uplambda \right)l.\) A new direction of the photon packet \(\overrightarrow\upomega _i\prime\) is determined at each scattering event using a phase function of choice e.g. the Henyey–Greenstein function:
$$p_HG \left( cos\left( \uptheta \right) \right) = \frac14\uppi \frac1 – g^2 \left( 1 + g^2 – 2gcos\left( \uptheta \right) \right)^3/2 ,$$
(2)
where \(g\) is the anisotropy factor. The input parameters when applying this method are the optical properties and geometry of the medium, which determine the lengths and forms of individual photon trajectories.

MC simulation procedure and geometrical configuration of the developed sensor. Schematic presentation of MC simulation procedure, (a) geometrical configuration of the developed sensor, (b) example MC simulations of optical signal propagation for the extended SmartWatch sensor configuration in human skin with topical water/sweat layer at 970 nm (top) and 1450 nm (bottom), (c).
Based on the extensive knowledge of light-tissue interaction and in silico experimentation, we have designed and produced the actual hardware prototype of a novel multi-wavelength optical sensor which has been currently built into the common Samsung Galaxy Watch Active 2 device therefore extending its capabilities extensively. One of the main futures of the sensor is its prolonged spectral sensing range. Complimentary to the two existing 535 and 645 nm sensors two wavelengths (970 and 1450 nm), have been added in order to enable signal acquisition in the Near-infrared (NIR) region. The choice of those wavelengths is due to the fact that in the NIR region of the spectrum, the absorption of hemoglobin and melanin practically does not affect the variation in skin spectrum while water and lipids become the dominant absorbers and several bands, namely 970, 1200, 1450, 1900 nm correspond to dermal water36 (Fig. 3). By design, novel receivers have been made square-shaped with 1.5 mm sides, two silicon detectors replaced with specialized germanium ones, performing adequately in NIR region up to 1800 nm. Center-to-center separation between Light-emitting diode (LED) and Photodetector (PD) has been selected using two configurations of 3.5 mm and 5.5 mm depending on particular pair of LED and PD which takes into consideration light’s mean free path (mpf) in different regions of human skin (Fig. 4b).
In this this work, we utilize GPU-accelerated MC simulation platform37. An object-oriented design, along with parallelization through NVIDIA’s CUDA (Compute Unified Device Architecture), enables the model to encode photon-tissue interactions and yield results in real-time. In order to simulate light transport and study sensor signal formation, we utilize a seven-layer optical model of human skin, extensively described in earlier publications20,21. Concisely, we consider three major parts: epidermis, dermis and hypodermis which are split into seven functional sub-layers. The optical properties of these layers are described by the specular reflection at the skin-air interface as well as light absorption and scattering therein. We considerably extended the original model into the near infrared range and introduced varying concentrations of chromophores such as melanin \(\left(C_mel\right),\) blood \(\left(C_blood\right),\) oxygen saturation \(\left(S_blood\right),\) as well as the topical water/sweat layer and their corresponding influence on the detected signal at 535, 645, 970 and particularly 1450 nm wavelengths (Fig. 4c).
Experimental validation of the developed approach
PPG signal produced by SmartWatch sensor largely depends on skin type, its internal properties and external factors such as presence of wrist movement during acquisition of the signal, placement of the device on the wrist, etc. There are also a number of constrains: for instance, the device should not be overtight (i.e. pulling the skin) for the correct operation of sensors. These factors have a lot of flexibility and therefore comprehensive numerical, experimental and data analysis studies in order to determine their margins needs to be performed.
First of all we validated our light transport simulation methods by taking four healthy male and female volunteers and performed several spectral, ultrasonic and SmartWatch skin measurements using laboratory grade equipment. Initially, we captured reflectance spectra of the dry and wet skin of the dorsal surface of the wrists of the left hand. Subsequently, skin thickness has been investigated at the three sites of dorsal surface (medial region) of the wrists of the left hand. Ultrasound images allowed to clearly distinguish the three major functional layers of skin and evaluate their thicknesses, respectively (Fig. 5a, b).
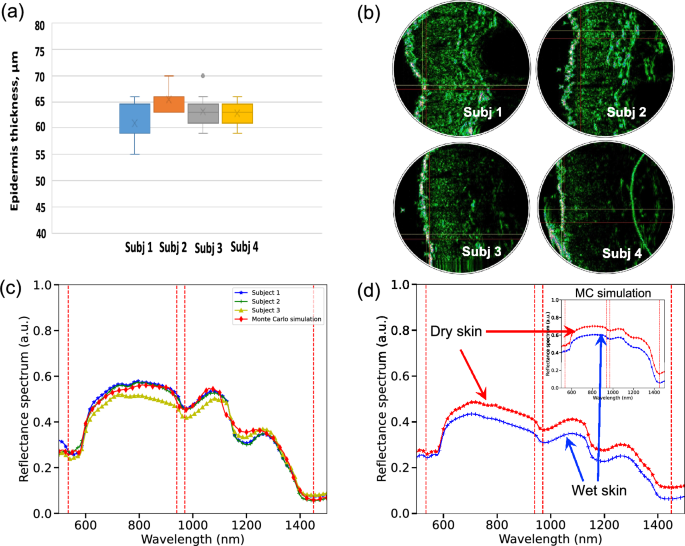
Skin measurements using laboratory grade equipment. An example of evaluated thicknesses (a) and ultrasound images (b) for test subjects for dorsal surface of the wrists of the left hand; MC simulated human skin reflectance spectra compared with the in vivo measurements for several Caucasian skin types (c); MC simulations compared with measurements for wet skin for the entire spectral profile (d).
Measuring thickness of skin is an important factor in validation and overall reduction of parameter space. From ultrasonic measurements the mean skin thickness per body site per subject has been estimated. The thickness of the “incoming echo” was considered without taking into account artifacts (hair, air microbubbles) on a smooth skin region with minimal manifestations of deformation, the thickness of which corresponds primarily by the corneal layer of the epidermis. In vivo measurements have been directly utilized in the computer studies of the PPG signal formation of SmartWatch.
We have mimicked in silico the exact configuration of the developed sensor, the distributions of thicknesses and corresponding optical properties of skin layers. Figure 6a shows several representative cases, where the output of MC simulations and the experimental data has been directly compared for multiple subjects. We achieved excellent match between our computational models and laboratory grade measurements (Fig. 5c, d).

MC simulations. MC simulations and notable trends due to the influence of the increasing thickness of sweat/water film on PPG signal for specific wavelengths of extended SmartWatch sensor (a). Complete 2D maps of human skin reflectance for increasing sweat/water layer thickness and the angle of incidence at the wavelengths 970, and 1450 nm (b, c).
Identifying features of importance using Monte Carlo and Machine Learning (ML) techniques
Due to excitement, stress, physical exertion, the activity of sympathetic nervous system increases, resulting in the surges of concentration of selected neurotransmitters. The cascades of signal pathways and enzymatic biochemical processes are launched in sweat glands, ensuring the secretion of the sweat fluid38. As a result, the sweat film between SmartWatch and wrist skin is formed, which affects the form of a PPG signal. In order to identify the generalized trends, first we have performed MC simulations of the influence of the sweat film thickness between the skin and the PPG sensor (Fig. 6a). Subsequently, simulation of the wrist movement has been performed by changing the angle of incidence of the probing light and combining the increasing thickness of sweat film. With the incidence angle modulation, we were able to estimate a complete set of 2D maps showing the performance of SmartWatch sensor under a variety of detection conditions (Fig. 6b and c).
Several useful trends have been identified both in modeling and measurements: formation of water/sweat film results in the uptrend for 970 nm and corresponding distinct opposite downtrend for 1450 nm. This can be explained by the changing combined skin/water absorption/reflection properties at specific wavelengths. For example, at 970 nm combined PPG signal for wet skin generally (but not always) results in the uptrend compared to baseline whereas 1450 nm exhibits a confident downtrend as it is situated at the known water absorption peak, correspondingly. Apart from water, signal at 970 nm is found to be more sensitive to skin type, its thickness and the effects associated with blood pulsation. Both PPG signals are affected by wrist motion and resulting measurements artifacts.
Nevertheless, transitioning laboratory insights to the measurements obtained with the device in consumer settings remains challenging. Therefore, we performed an advanced analysis of unique dataset (19 human subjects who participated in 103 indoor running trials of 5 km total distance). More information about subjects’ characteristics and ambient conditions can be found in chapter “Materials and methods” and see (ref.6).
Diversity of the initial experimental conditions, subject physiology, etc. makes it challenging to determine the exact moment at which sweat film starts to appear. It is not always perceived whether there is sweat under the SmartWatch or not i.e. perception of the sweat on the face is more pronounced then the feeling of sweat on the hand. Moreover, peculiarities of sweating process for each person, speed of sweat saturation of the surface of the skin result in considerable differences in the amount of the liquid under the watch.
With our primary goal is to be able to detect the moment within a certain confidence interval when the film appears using the changes in PPG signal we utilized a simple standard paper sticker method where a paper sensor with embedded dry ink changes color due to sweat presence. In this study we used this as our reference method for determination of the moment of occurrence of a sweat film under smart watch. The sticker sensor was placed on the hand of the runner and positioned under a smart watch. Notably, the exact moment of sweat film occurrence, determined with the sticker sensor, was captured slightly earlier than the runner’s personal feeling of sweating. Since all runners were sweating, we investigate the entire PPG dataset throughout the run, to see what generalized changes occur in the signal over the entire run. Physical activity creates several distinct artifacts, mostly related to the movement. We have been extensively looking into these issues and found that PPG signal can easily be corrupted by the combination and influence of several external factors including wrist movement, physical activities, ambient light, ambient temperature and pressure arising from the contact between PPG sensor and skin.
In particular, the influence of wrist movement become more apparent in the case of extremes: e.g. too loose or too tight strap tension of smartwatch. We have monitored the pressure and associated effect for a variety of strap tensions of our smartwatch. Therefore, monitoring those artifacts is crucial for continuous acquisition and we specifically developed a sensor fusion approach to investigate the artifacts resulting from the physical activity, which were mostly related to the movement.
We utilized sensor fusion approach to investigate the artifacts resulting from the physical activity which are mostly related to the movement (Fig. 7). In our SmartWatch the artifacts in the PPG signals are estimated from the IMU (inertial measuring unit) data collected simultaneously with PPG signals. The individual components of PPG signal were investigated by transforming it from time to frequency domain. In order to provide an additional example, we are able to detect distinct frequency corresponding to the heart-beat component in PPG and the others corresponding to a variety of motion artifact contributions.
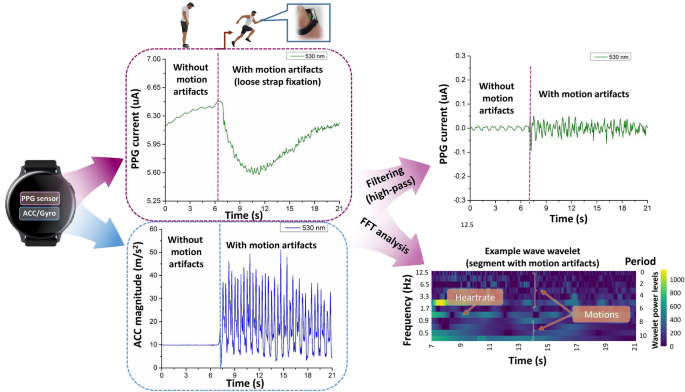
Sensor fusion allows distinguishing various types of artifacts such as motion, movement of arms, steps, heartbeat, etc.
We noted a high-order correlation with the following factors: running speed, arm swings, tightness of the band, the actual positioning of Smart Watch on the wrist and the body physic of the runner. Likely, the nature of the noise artifacts is not changing, and they can still be quantified by several well-known algorithms. Within a framework of this research, we created a complete capturing, modeling and analysis pipeline (depicted in Fig. 2) specifically tailored to access hydration proprieties of skin with SmartWatch in order to identify the exact moment when sweating occurs. Therefore, we could make several assumptions regarding the key changes occurring during the run that can affect the PPG signal. Firstly, changes in steps per minute (spm) are likely to occur when a person is getting tired, or the test run is commenced. Secondly, the distinct changes in the heart rate beats per minute (bmp) are extremely likely during the runs. Finally, the appearance of sweat is a plausible outcome of an intense exercise. We approach the task by attempting to classify the start and the end of the runs. This task can be represented as a binary classification problem, where the positive class is the end of the run, and the negative class is its start. Subsequently, we test the hypothesis is that if we are able to classify the individual sections of the run with confidence, we can find the signs indirectly indicating the moment of appearance of a sweat film.
Following modeling and experimental validation we specifically focused on investigating data features at 970 and 1450 nm wavelengths by training several ML-based classifiers. Our analysis workflow is presented in Fig. 8 and includes several important steps. Firstly, by selecting two windows (3.5 min duration) on the left (start run) and on the right (end run). From each window we extracted time and frequency domain features. Having done this for each user’s run, we assembled a dataset to train the (LightGBM)39 classifier where left window represent negative class and right window represent positive class. After we move windows closer to each other by 20 s step, repeated same procedure and train new classifier. We move the windows to each other until they begin to overlap. In total, we have trained 23 classifiers.
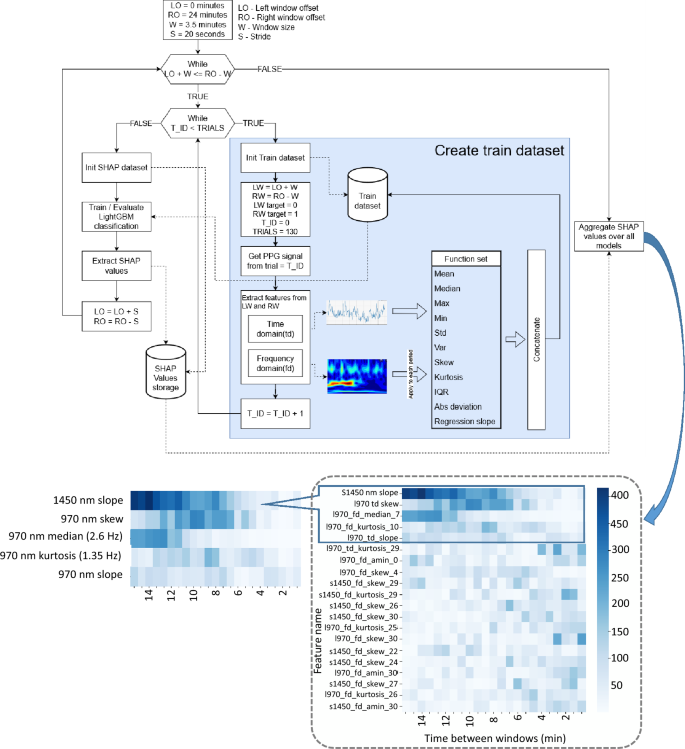
Schematic presentation of workflow used to investigate the quality of ML models for reliable identification of sweat film appearance. A number of prominent models have been obtained with the various quality of classification. Each column on the SHAP chart represents a different LightGBM model, the row represents the top 20 features, and the color represents their importance. Each feature name have name pattern <wave length>_<domain>_<function>_ <channel (for frequency domain only)>.
On each trained classifier we performed a Shapley Additive Explanations (SHAP)40 feature importance analysis. After ranking the features, we selected the 20 most important for analysis (Fig. 9).Time domain features were obtained from completely raw unprocessed signal, frequency domain features involved conversion to the wavelet spectrum. Significance of the following features has been investigated Mean, Median, Max, Min, Std, Var, Skew, Kurtosis, IQR, Median abs deviation, Trend slope. For the time domain data, these functions were applied to the raw signal. For the frequency domain, the functions were applied to each channel of the wavelet transform spectrum. We got a total of 642 features. For the wavelet transformation we used the ssqueezepy library41. As a wavelet function we used the Generalized Morse Wavelet42. Each LightGBM model has been trained with same parameters max_depth = 2 and learningrate = 0.01 the rest of the parameters were default. To estimate the performance, we used cross validation by 4 folds.
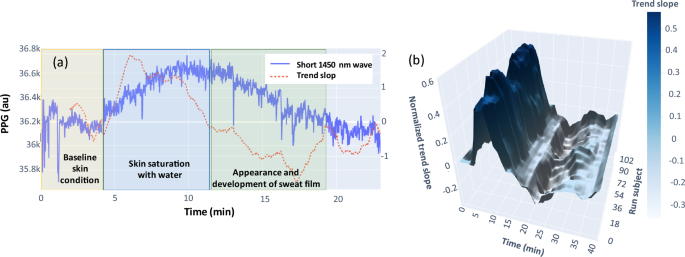
An example of the 1450 nm trend showing the monotonic changes in reflection compared to baseline such as skin saturation, appearance and development of sweat film (a). 3D representation of the generalized 1450 nm trend for the entire consumer study (b).
A total of 23 models corresponding to the different time between windows. A high quality of classification has been obtained between windows of more than 15 min resulting in accuracy score values greater than 0.7. This refers to significant differences at the beginning and end of the run. For further study, we selected three main candidate features including: frequency domain features corresponding to the heart rate. For example, the median value of the spectrum on period 7 corresponding to a frequency of 2.6 Hz at a sampling rate of 25 Hz is occupied by the pulse wave. Due to the heart rate changes during test runs, this signal is important in classifying the individual sections of the run. This hypothesis has been extensively evaluated by taking the PPG signal at 970 nm and filtering it from any other frequencies, so we can actually see some analogy to the pulse wave. It confirmed the 970_td_skew feature which has little contribution at the beginning and the end of the run due to the heart rate being stabilized at this regions, similar to the case of 10 min after the start of the run. We assume that both of these features are a consequence of heart rate change during a run.
Our main feature for classification however is the monotonic change in the 1450 nm wavelength signal (1450_nn_slope). We associate this phenomenon with the appearance of a sweat film. The monotonic change fits well with the MC numerical simulations and the fact that the film does not appear instantly. This process is not instant and stretched over time, i.e. transitioning from baseline, skin saturation and at some point sweat film appearing on the skin surface. Evaluating PPG signal at 1450 nm captures these monotonic changes in reflection, respectively.
Figure 9 shows the presence of such trends from 4 to 10 min and from 11 to 20 min associated with the formation of the sweat film.
We can see that starting from the fourth minute, the trend begins its monotonous increase with this process taking place until the 10th minute, subsequently, the trend reverses. In order to determine the trend direction a practical time interval has been selected. We found that the optimal smoothing of the signal is in a window of 2 to 5 min. These time windows allow us to detect quite clearly the appearance of trends during the exercise time. We performed this procedure for all the trials and averaged the values over a window of 5 min and over 5 subjects, and also normalized the value of the slope. With the 3-dimensional graph we can see that on average the positive slope appears from ~ 5 min with peak at ~ 9 min, which changes to negative from ~ 14 min to ~ 20 min. This conforms well with our task of optical detection of sweat film formation within 2-min accuracy window and paves the way for future assessment of sweat body loss and development of a practical applications notifying consumer of the need to rehydrate.